In this article, we explore the most common STEMI mimics, their clinical and ECG characteristics, and the role of advanced diagnostic tools, including AI-driven solutions, in aiding accurate and timely diagnosis.
The diagnosis of ST-Elevation Myocardial Infarction (STEMI) is a time-sensitive clinical challenge with critical implications for morbidity and mortality1. However, identifying a true STEMI based solely on ECG changes is not always straightforward, as a number of other conditions, collectively termed STEMI mimics, can produce ST-segment elevations without underlying myocardial infarction2. Misinterpreting these mimics as true STEMI can lead to unnecessary cath lab activations, resulting in invasive procedures that carry inherent risks3.
While the ECG is a crucial rule-in test for STEMI diagnosis, it is not a reliable rule-out test. This means that while significant ST-elevation on an ECG strongly suggests myocardial infarction and warrants urgent action, the absence of these findings does not necessarily exclude acute coronary syndromes (ACS)4. It is critical to correlate ECG findings with the patient’s clinical presentation, symptoms, and additional diagnostic markers, such as troponin levels, to ensure an accurate diagnosis5.
In this article, we explore the most common STEMI mimics, their clinical and ECG characteristics, and the role of advanced diagnostic tools, including AI-driven solutions, in aiding accurate and timely diagnosis.
Table of Contents
What Are STEMI Mimics?
STEMI mimics are conditions that cause ST-segment elevation on an ECG but are not due to acute coronary occlusion. These may be cardiac or non-cardiac in origin, and each presents a unique challenge to the clinician2.
Unnecessary cath lab activations due to STEMI mimics are relatively common, with studies estimating that approximately 10-36% of patients presenting with ST-segment elevation on ECGs do not have an acute coronary occlusion upon angiography6,7. Misdiagnosing these conditions as STEMI can lead to inappropriate interventions, exposing the patient to potential complications of invasive procedures, such as contrast-induced nephropathy, radiation exposure, bleeding, and others6,7.
The ability to distinguish these mimics is essential for patient safety and resource optimization in busy emergency settings7.
STEMI mimics are conditions that cause ST-segment elevation on an ECG but are not due to acute coronary occlusion. These may be cardiac or non-cardiac in origin, and each presents a unique challenge to the clinician2.
Common STEMI Mimics and Their Diagnostic Pitfalls
Some of the most notable conditions mimicking STEMI include subarachnoid hemorrhage, Left Bundle Branch Block (LBBB), pericarditis, spontaneous coronary artery dissection (SCAD), hyperkalemia, ventricular paced rhythm, Brugada syndrome, hypothermia, Prinzmetal’s/Variant angina, pulmonary embolism, Takotsubo cardiomyopathy, ventricular aneurysm, left ventricular hypertrophy, early repolarization, and thoracic aortic dissection. Each of these conditions can present with ECG changes that resemble STEMI, yet they require different treatment approaches, underscoring the importance of careful clinical evaluation8.
Below, we examine several STEMI mimics, focusing on their ECG characteristics, the mechanisms behind their resemblance to STEMI, and some of the key clinical clues that help differentiate them.
Identify STEMI Mimics with Certified AI
Leverage PMcardio platform to accurately distinguish true myocardial infarctions from STEMI mimics in seconds.
- Medical Device Class II(b) EU MDR CE-mark
- 2x higher sensitivity in occlusive MI detection
- 3h faster time to diagnosis
- 5 FREE ECGs/month - no credit card needed

Pericarditis
Pericarditis, though rarer than myocardial infarction, is an inflammatory condition affecting the pericardium, which can be of infectious (often viral) or non-infectious origin, including autoimmune diseases, cancer, post-cardiac injury syndromes, post-myocardial infarction syndromes, Dressler’s syndrome and others9,11.
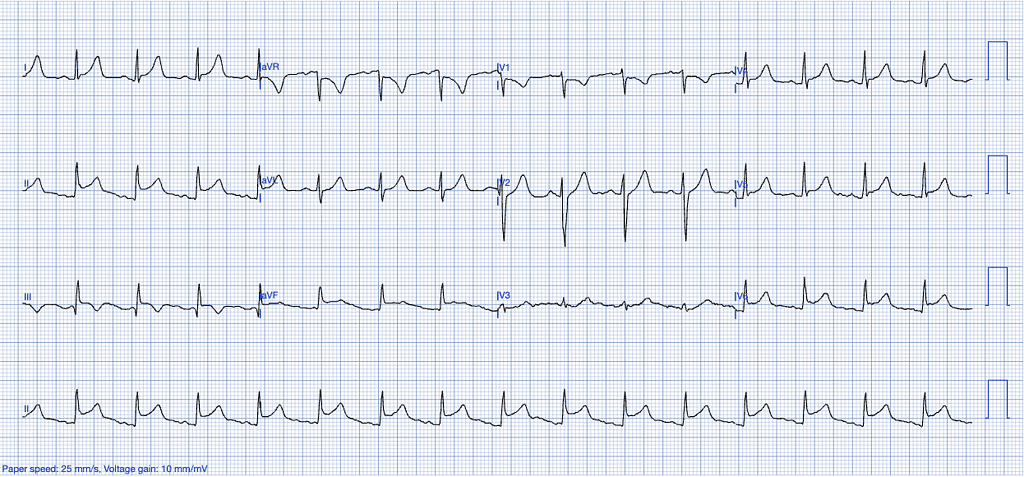
ECG Features of Pericarditis
- Upward concavity of the ST segments, unlike the more horizontal or convex ST elevation often seen in STEMI.
- Absence of reciprocal changes typically seen in STEMI, except in leads aVR and V1.
- ST elevation is usually greater in lead II than in lead III, whereas the opposite is a strong indicator of STEMI.
- Absence of hyperacute T waves – T waves in pericarditis are neither tall nor bulky, with a relatively small area under the curve compared to the QRS complex.
- PR-segment depression in leads with ST-elevation, particularly in the inferior leads.
- Absence of reciprocal changes typically seen in STEMI10.
Clinical Clues
- Sharp, pleuritic chest pain that worsens with inspiration or lying down and improves when sitting upright.
- Pericardial friction rub on auscultation.
- Absence of elevated troponin levels, or mild elevation if myocarditis is also present10.
How Pericarditis Mimics STEMI
Pericarditis can lead to localized ST elevation, but unlike STEMI, it typically lacks reciprocal ST depression, except in leads aVR and V1. Both conditions can produce concave ST elevation, but only STEMI typically results in convex or horizontal ST elevation. Additionally, if the ST elevation is greater in lead III than in lead II, this is a strong indicator of STEMI. PR-segment depression is mostly associated with viral pericarditis and tends to be a transient, early feature, lasting only a few hours12.
Left Ventricular Hypertrophy (LVH)
LVH results from chronic pressure overload, often due to long-standing hypertension or aortic stenosis. The hypertrophied myocardium alters the electrical conduction patterns, leading to ST-segment abnormalities on the ECG13.
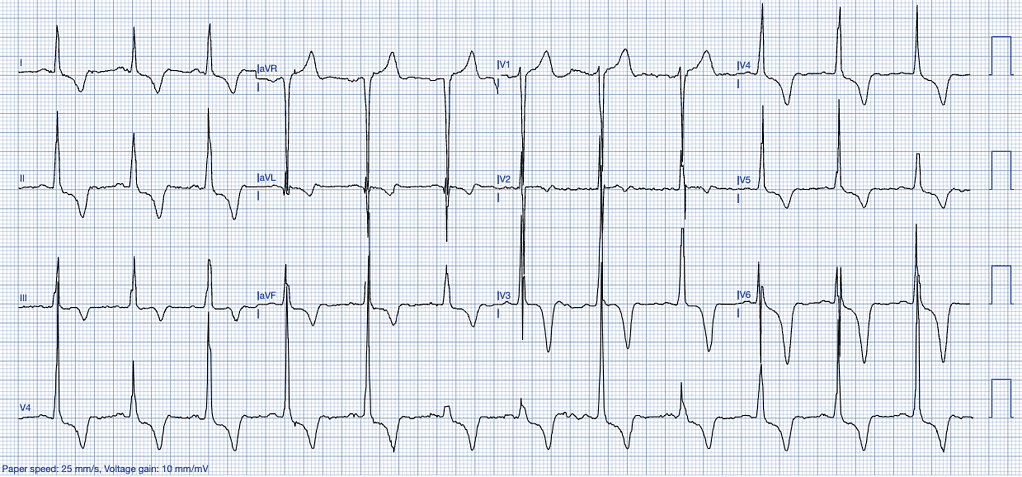
ECG Features of Left Ventricular Hypertrophy:
- High-voltage QRS complexes, especially in the precordial leads (V1-V6).
- ST-segment elevation is predominantly observed in the anterior leads (V1-V3), often accompanied by T-wave inversions. This elevation typically occurs in the context of high-voltage S-waves, with the ST/S ratio generally being less than 0.15. An ST/S ratio exceeding 0.15 suggests that the findings are unlikely to be attributable to left ventricular hypertrophy (LVH) (Smith, personal experience).
- Strain pattern with ST-depression and T-wave inversions in the lateral leads14.
Clinical Clues
- History of hypertension or aortic valve disease.
- Echocardiographic evidence of hypertrophy.
How LVH Mimics STEMI
The elevated voltage in the anterior leads and associated strain pattern can mimic an anteroseptal infarction. LVH-induced repolarization abnormalities can lead to confusion, especially in the absence of a clear clinical picture of ACS15 and is frequently identified as a cause of ‘false-positive’ emergent angiography34.
Early Repolarization
Early repolarization is a benign ECG variant most commonly seen in young, healthy individuals, particularly athletes. It represents a variation in the electrical activity of the heart’s repolarization phase16.
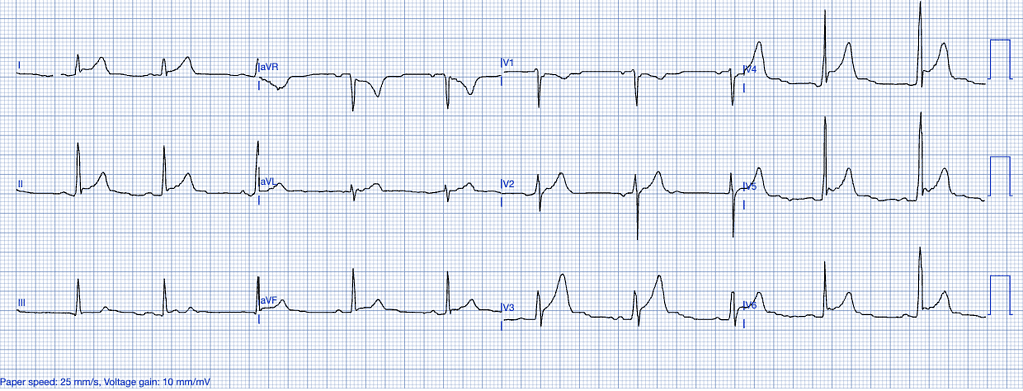
ECG Features of Early Repolarization
- ST-segment elevation, typically concave, in the precordial and inferior leads.
- Notching or slurring of the J-point, especially in the lateral leads.
- No reciprocal ST-segment depression or evolving ECG changes17.
Clinical Clues
- Asymptomatic or discovered incidentally.
- No associated chest pain or cardiac risk factors16,18.
How Early Repolarization Mimics STEMI
Early repolarization can closely mimic the ST-elevations seen in anterior or inferior STEMI, especially when J-point notching or slurring is present. Differentiation relies on the absence of clinical symptoms, reciprocal changes, and the stability of the ECG over time16.
Left Ventricular Aneurysm
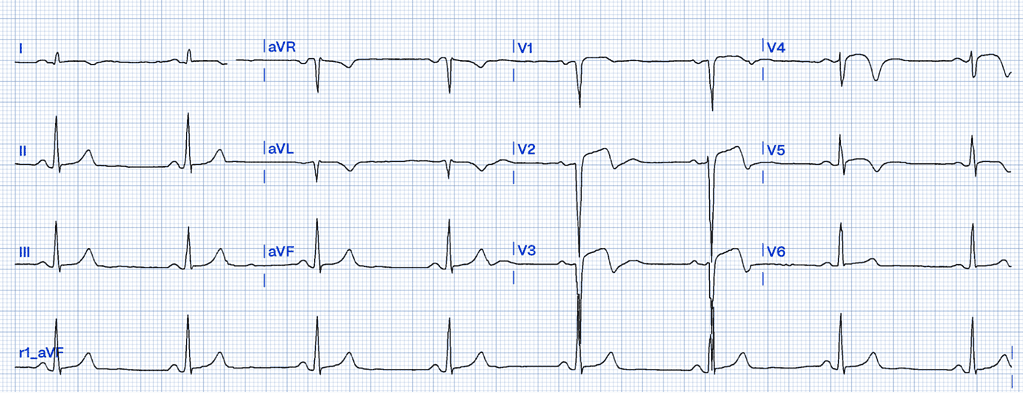
Left ventricular aneurysm (LVA) is a condition that typically develops as a late complication following a myocardial infarction (MI). It results from scar tissue formation in the left ventricular wall, leading to a localized area that bulges outward during systole. Unlike acute coronary syndromes like STEMI, LVA is a chronic state rather than an acute event, yet its ECG findings can closely resemble those of a myocardial infarction, making differentiation essential to avoid misdiagnosis37.
ECG Features of Left Ventricular Aneurysm
- Persistent ST Elevation: ST elevation in LVA is usually chronic, persisting weeks to months after an MI. It is often localized to the leads corresponding to the area of the scarred myocardium, most commonly the anterior leads (V1-V6). This elevation is typically concave and less pronounced compared to the acute elevation seen in STEMI37.
- Absence of Reciprocal Changes: Unlike STEMI, which often presents with reciprocal ST depression in opposing leads, LVA usually lacks these changes37.
- T-Wave Characteristics: In LVA, T waves are not hyperacute but rather diminished and flattened compared to the QRS complex. A key differentiator is the ratio of T-wave to QRS amplitude. According to Smith, a T/QRS ratio greater than 0.36 is suggestive of acute MI rather than LVA36 .
- Q Waves: Deep, persistent Q waves are often seen in the same leads as the ST elevation. These Q waves indicate myocardial necrosis rather than active ischemia37.
Clinical Clues
- History of Prior MI: A history of MI weeks to months earlier is a critical clinical clue when interpreting persistent ST elevation.
- Absence of Acute Symptoms: Patients with LVA often lack the acute chest pain typical of STEMI. Symptoms, if present, may relate to heart failure or arrhythmias rather than acute ischemia.
- Troponin Levels: Troponin levels in LVA are typically not elevated, or they may be mildly elevated if there is concurrent myocardial stress or small areas of ongoing ischemia37.
How LVA Mimics STEMI
LVA can cause persistent ST elevation in anterior leads that closely resembles the pattern seen in an anterior STEMI. However, the chronicity and lack of reciprocal changes differentiate it from an acute MI. Additionally, while STEMI often results in convex or horizontal ST elevation, LVA usually maintains a concave ST pattern. Notably, the presence of deep Q waves in the affected leads and a diminished T/QRS amplitude ratio are further distinguishing factors36,37.
Previously Diagnosed Left Bundle Branch Block (LBBB)
LBBB is a conduction abnormality that affects the left ventricle, causing delayed depolarization and abnormal repolarization patterns. While an old, previously diagnosed LBBB often reflects underlying structural heart disease or chronic conditions, distinguishing whether it is new or old may not significantly impact the incidence of an acute myocardial infarction.
The most critical aspect in assessing ischemia in the context of LBBB is the application of the Smith Modified Sgarbossa Criteria, which is currently the most sensitive set of criteria available for identifying OMI in LBBB cases.
However, it is important to note that, despite being more sensitive than traditional STEMI criteria used in patients with normal conduction, the Smith Modified Sgarbossa Criteria may still miss a substantial portion of cases. This makes the interpretation of the ECG in the context of LBBB particularly challenging, especially when other clinical signs of ischemia are present20.
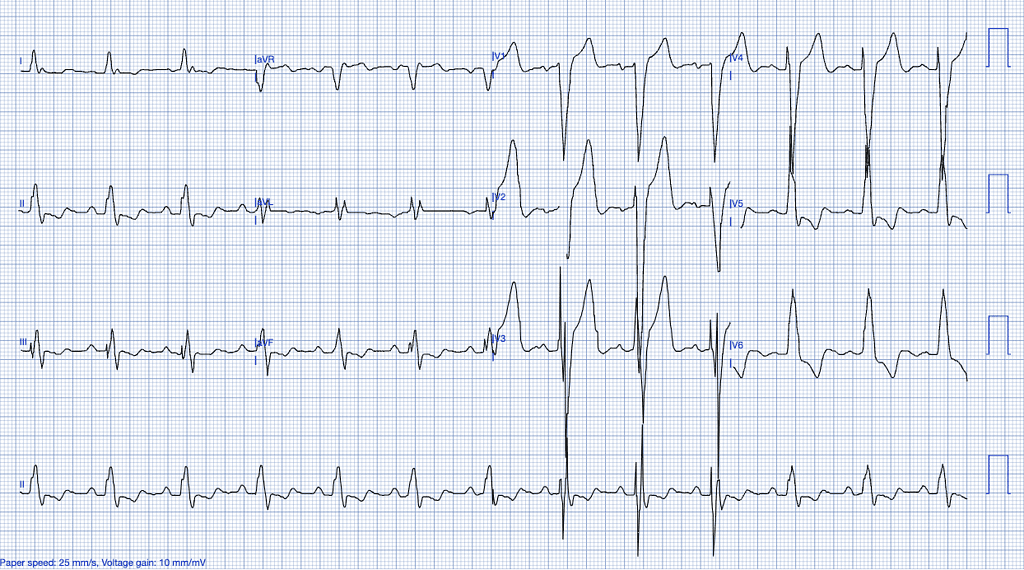
ECG Features of Previously Diagnosed LBBB
- Wide QRS complexes (>120ms).
- Discordant ST-segments (ST-segment elevation in leads with a predominantly negative QRS and depression in leads with positive QRS complexes).
- Absence of normal septal Q-waves in leads I, aVL, V5, and V621.
Clinical Clues
- Often seen in patients with underlying cardiomyopathy or ischemic heart disease.
- Symptomatology may range from asymptomatic to severe heart failure19.
Why LBBB Mimics STEMI
LBBB creates significant abnormalities in both the depolarization and repolarization of the ventricles, making it difficult to interpret ST-segments. This necessitates the use of additional diagnostic tools, such as coronary angiography, or more sophisticated ECG interpretation models, like PMcardio, which can accurately interpret complex conduction abnormalities in LBBB and paced rhythms22.
Identify STEMI Mimics with Certified AI
Leverage PMcardio platform to accurately distinguish true myocardial infarctions from STEMI mimics in seconds.
- Medical Device Class II(b) EU MDR CE-mark
- 2x higher sensitivity in occlusive MI detection
- 3h faster time to diagnosis
- 5 FREE ECGs/month - no credit card needed


Ventricular Paced Rhythm
Ventricular paced rhythm (VPR) is characterized by an artificial pacing stimulus from a pacemaker that creates a wide QRS complex resembling a LBBB. This makes the ECG interpretation of MI challenging, as the usual ST-segment changes seen in ACS may be masked or altered in the presence of pacing. However, the Modified Sgarbossa Criteria have been validated as effective in diagnosing acute coronary occlusion in VPR, aiding clinicians in identifying MI when standard criteria might fail38.
ECG Features of Ventricular Paced Rhythm
- Discordant ST Elevation: The Modified Sgarbossa Criteria use the degree of discordance between the ST-segment and the QRS complex. An ST-segment elevation greater than 25% of the preceding S-wave amplitude in any lead indicates MI38.
- Concordant ST Elevation or Depression: Concordant ST elevation (ST elevation in the same direction as the QRS complex) of ≥1 mm in any lead also supports the diagnosis of acute MI in VPR. Concordant ST depression in leads V1-V3 is another key indicator36.
- Absence of Hyperacute T Waves: In contrast to typical ST-elevation myocardial infarction (STEMI), hyperacute T waves may not be present in VPR. T waves in VPR are often discordant, making it difficult to distinguish them from baseline abnormalities caused by the pacing.
Clinical Clues
- Patient History and Symptoms: Symptoms of chest pain and history of coronary artery disease are critical in suspecting an MI in the context of VPR.
- Troponin Elevation: Elevated troponin levels alongside the ECG criteria mentioned can confirm the diagnosis.
- Advanced Imaging: Given the diagnostic difficulties, further imaging modalities like echocardiography may be necessary to support the findings36.
How Ventricular Paced Rhythm Mimics STEMI
VPR can obscure classic STEMI findings due to the wide QRS and altered ST-segments caused by pacing. This overlap necessitates the use of modified criteria to accurately diagnose acute MI, as standard STEMI criteria are often not applicable. Proper application of the Modified Sgarbossa Criteria helps in distinguishing true occlusive MI from baseline ECG abnormalities related to pacing38.
Brugada Syndrome
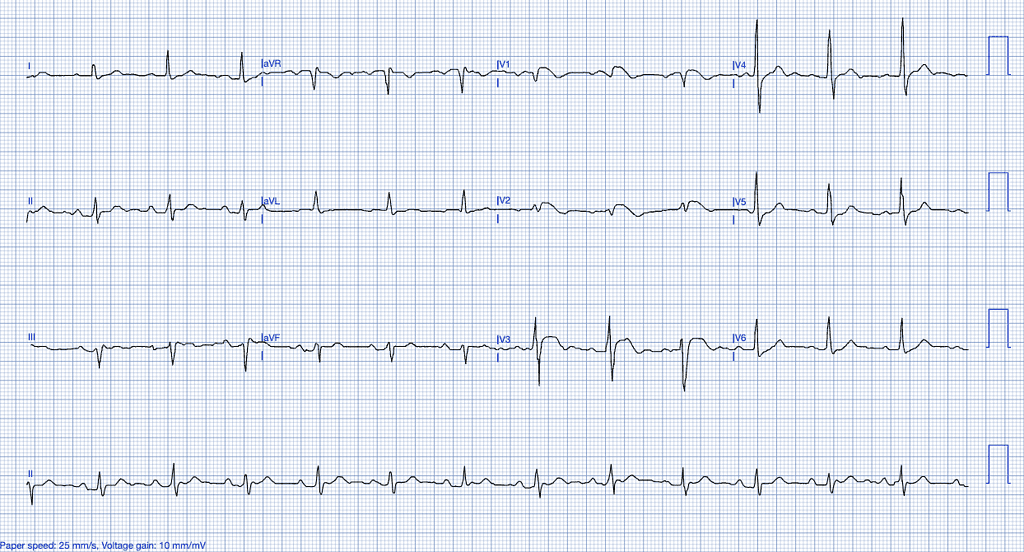
Brugada syndrome is a genetic condition affecting the sodium channels of the cardiomyocytes, specifically through mutations in the SCN5A gene, predisposing individuals to ventricular arrhythmias and sudden cardiac death23,24.
ECG Features of Brugada Syndrome
- ST-segment elevation in the right precordial leads (V1-V3) with a coved or saddleback pattern25.
- T-wave inversion in the right precordial leads.
- Right bundle branch block (RBBB) pattern may also be present26.
Clinical Clues
- Typically presents in young men with a history of syncope, palpitations, or sudden cardiac arrest23.
- Family history of sudden cardiac death or arrhythmias24.
- Typically presents without chest pain and can be exacerbated by fever, which increases the risk of arrhythmias due to the temperature sensitivity of sodium channels27.
How Brugada Syndrome Mimics STEMI
Brugada syndrome can present with ST-segment elevation in the anterior leads, mimicking a STEMI involving the LAD territory. The absence of reciprocal changes and the coved morphology of the ST-elevation are key distinguishing features25.
Hyperkalemia
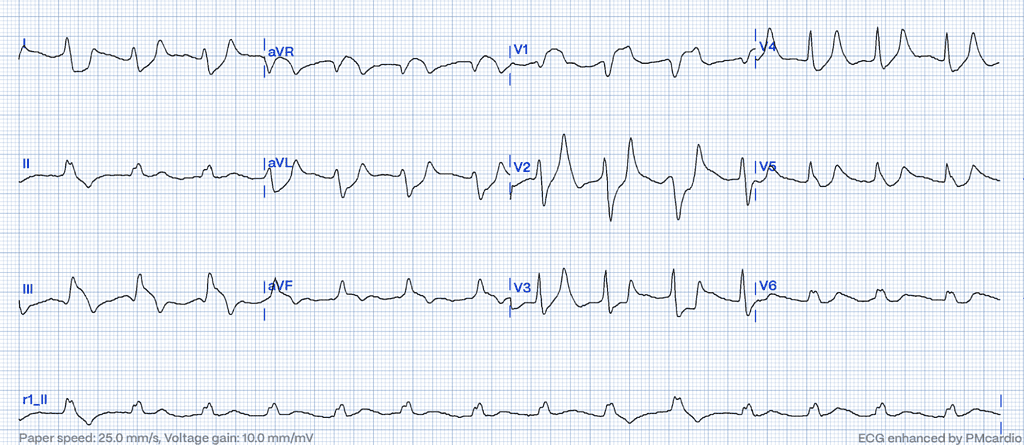
Hyperkalemia alters cardiac depolarization and repolarization due to elevated extracellular potassium levels, affecting the resting membrane potential of cardiac myocytes28.
ECG Features of Hyperkalemia
- Peaked T-waves, particularly in the precordial leads.
- Flattening or absence of P-waves.
- Wide QRS complexes that can merge with ST-segments, creating a sine-wave appearance in severe cases29.
Clinical Clues
- History of renal failure, potassium-sparing diuretic use, or other causes of hyperkalemia.
- Symptoms of muscle weakness, fatigue, or arrhythmias28,30.
How Hyperkalemia Mimics STEMI
Severe hyperkalemia can cause broad ST-elevation and wide QRS complexes that may resemble ischemic changes on the ECG. The absence of reciprocal changes, the clinical context, and rapid normalization of the ECG after correcting potassium levels are important clues31.
Pulmonary Embolism
Pulmonary embolism (PE) is a potentially life-threatening condition characterized by a blood clot obstructing a pulmonary artery. While PE primarily causes respiratory symptoms, it can sometimes mimic STEMI on an ECG, complicating diagnosis and treatment.
ECG Features of Pulmonary Embolism
- S1Q3T3 Pattern: The classic ECG finding in PE is an S wave in lead I, a Q wave, and an inverted T wave in lead III (S1Q3T3). However, this pattern is neither sensitive nor specific for PE39.
- Tachycardia: Sinus tachycardia is the most common ECG finding, although it is nonspecific and can be seen in various conditions39.
- ST Elevation Mimicry: PE can occasionally produce ST elevation in the inferior and anterior leads, resembling a myocardial infarction. Differentiating these conditions requires clinical correlation and imaging to confirm PE39.
Clinical Clues
- Dyspnea and Pleuritic Chest Pain: Unlike STEMI, PE is often associated with respiratory symptoms such as sudden dyspnea and pleuritic chest pain.
- Hypoxia: Hypoxia and elevated D-dimer levels may support the diagnosis of PE.
- Troponin Elevation: Mild troponin elevation may be seen in PE, but it is usually not as pronounced as in an acute MI.
How It Mimics STEMI
PE can lead to right heart strain, causing ST elevation and T wave inversions that mimic STEMI. However, unlike STEMI, the ST changes in PE often appear in atypical distributions and lack the reciprocal changes typical of myocardial infarction. A high clinical suspicion and the use of imaging studies such as CT pulmonary angiography are crucial for correct diagnosis39.
The Role of Advanced Diagnostics in Identifying STEMI Mimics
In the high-pressure environment of emergency care, where minutes matter, distinguishing between true STEMI and STEMI mimics can be a daunting task. While clinical context, patient history, and laboratory findings (such as troponin levels) are essential, the ECG remains the cornerstone of diagnosis. However, traditional ECG interpretation can be challenging in the presence of conduction abnormalities, hypertrophic changes, or benign variants.
This is where PMcardio offers a distinct advantage. By utilizing advanced deep learning algorithms trained on extensive datasets of ECGs, our AI is capable of distinguishing true myocardial infarction from common STEMI mimics with high precision22. The tool analyzes patterns that may be difficult to detect with the naked eye, reducing unnecessary cath lab activations and invasive procedures.
Conclusion
STEMI mimics pose a significant challenge to emergency care providers, with the potential for both over- and under-treatment of patients presenting with chest pain and ST-segment elevation. Careful ECG interpretation, clinical context, and advanced diagnostic tools are essential in differentiating these conditions from true STEMI. PMcardio, the AI-powered ECG platform offers clinicians an invaluable tool in making these critical decisions, ensuring that patients receive the right diagnosis and treatment32,33.
References
- Ibanez B, James S, Agewall S, et al. 2017 ESC Guidelines for the management of acute myocardial infarction in patients presenting with ST-segment elevation. Eur Heart J. 2018;39(2):119-177.
- O’Gara PT, Kushner FG, Ascheim DD, et al. 2013 ACCF/AHA guideline for the management of ST-elevation myocardial infarction. Circulation. 2013;127(4).
- Naidu SS, Abbott JD, Bagai J, Blankenship J, Garcia S, Iqbal SN, et al. SCAI expert consensus update on best practices in the cardiac catheterization laboratory: endorsed by the American College of Cardiology, the American Heart Association, and the Heart Rhythm Society. Catheter Cardiovasc Interv. 2021;98(2):255-276. doi:10.1002/ccd.29744.
- Moak JH, Muck AE, Brady WJ. ST-segment elevation myocardial infarction mimics: The differential diagnosis of nonacute coronary syndrome causes of ST-segment/T-wave abnormalities in the chest pain patient. Turk J Emerg Med. 2024;24(4):206-217.
- Thygesen K, Alpert JS, Jaffe AS, et al. Fourth universal definition of myocardial infarction (2018). Circulation. 2018;138(20).
- Larson DM, Menssen KM, Sharkey SW, et al. “False-positive” cardiac catheterization laboratory activation among patients with suspected ST-segment elevation myocardial infarction. JAMA. 2007;298(23):2754-2760. doi:10.1001/jama.298.23.2754.
- McCabe JM, Armstrong EJ, Kulkarni A, et al. Prevalence and factors associated with false-positive ST-segment elevation myocardial infarction diagnoses at primary percutaneous coronary intervention-capable centers: A report from the Activate-SF registry. Arch Intern Med. 2012;172(11):864-871. doi:10.1001/archinternmed.2012.157.
- Daley SM. STEMI mimics: A mnemonic. Available from: https://litfl.com/stemi-mimics-a-mnemonic [Accessed September 2024]
- Imazio M, Gaita F, LeWinter M. Evaluation and Treatment of Pericarditis: A Systematic Review. JAMA. 2015;314(14):1498-1506. doi:10.1001/jama.2015.12763.
- Adler Y, Charron P, Imazio M, et al. 2015 ESC Guidelines for the Diagnosis and Management of Pericardial Diseases: The Task Force for the Diagnosis and Management of Pericardial Diseases of the European Society of Cardiology (ESC). Eur Heart J. 2015;36(42):2921-2964. doi:10.1093/eurheartj/ehv318.
- Spodick DH. Acute Pericarditis: Current Concepts and Practice. JAMA. 2003;289(9):1150-1153. doi:10.1001/jama.289.9.1150.
- Pericarditis ECG Library. Life in the Fast Lane. Available from: https://litfl.com/pericarditis-ecg-library/. [Accessed 24 September 2024].
- Hancock EW, Deal BJ, Mirvis DM, et al. AHA/ACCF/HRS recommendations for the standardization and interpretation of the electrocardiogram: part V: electrocardiogram changes associated with cardiac chamber hypertrophy: a scientific statement from the American Heart Association. Circulation. 2009;119(10). doi:10.1161/CIRCULATIONAHA.108.191097.
- Goldberger AL. Clinical Electrocardiography: A Simplified Approach. 8th ed. Philadelphia: Elsevier; 2012.
- Okin PM, Devereux RB, Nieminen MS, et al. Electrocardiographic strain pattern and prediction of new-onset congestive heart failure in hypertensive patients: the LIFE Study. Eur Heart J. 2009;30(6):714-721. doi:10.1093/eurheartj/ehp008.
- Macfarlane PW, Antzelevitch C, Haissaguerre M, Huikuri HV, Potse M, Rosso R, et al. The Early Repolarization Pattern: A Consensus Paper. J Am Coll Cardiol. 2015;66(4):470–7.
- Rezus C, Floria M, Moga VD, Sirbu O, Dima N, Ionescu SD, Ambarus V. Early repolarization syndrome: electrocardiographic signs and clinical implications. Ann Noninvasive Electrocardiol. 2014 Jan;19(1):15-22. doi: 10.1111/anec.12113. Epub 2013 Sep 30. PMID: 24118137; PMCID: PMC6932182.
- Klatsky AL, Oehm R, Cooper RA, Udaltsova N, Armstrong MA. The early repolarization normal variant electrocardiogram: correlates and consequences. Am J Med. 2003;115(3):171–7.
- Birnbaum Y, Wilson JM, Fiol M, de Luna AB, Eskola M, Nikus K. ECG diagnosis and classification of acute coronary syndromes. Ann Noninvasive Electrocardiol. 2014;19(1):4-14.
- Sgarbossa EB, Pinski SL, Barbagelata A, Underwood DA, Gates KB, Topol EJ, et al. Electrocardiographic diagnosis of evolving acute myocardial infarction in the presence of left bundle-branch block. N Engl J Med. 1996;334(8):481-7.
- Surawicz B, Childers R, Deal BJ, Gettes LS, Bailey JJ, Gorgels A, et al. AHA/ACCF/HRS recommendations for the standardization and interpretation of the electrocardiogram: part III: intraventricular conduction disturbances: a scientific statement from the American Heart Association Electrocardiography and Arrhythmias Committee, Council on Clinical Cardiology; the American College of Cardiology Foundation; and the Heart Rhythm Society. Circulation. 2009;119(10)
- Herman R, Meyers HP, Smith SW, Bertolone DT, Leone A, Bermpeis K, et al. International evaluation of an artificial intelligence-powered electrocardiogram model detecting acute coronary occlusion myocardial infarction. Eur Heart J Digit Health. 2023;5(2):123-33. doi:10.1093/ehjdh/ztad074.
- Antzelevitch C, Brugada P, Brugada J, Brugada R. Brugada syndrome: From cell to bedside. Heart Rhythm. 2005;2(4):356-60.
- Campuzano O, Sarquella-Brugada G, Cesar S, Arbelo E, Brugada J, Brugada R. Update on genetic basis of Brugada syndrome: Monogenic, polygenic or oligogenic? Int J Mol Sci. 2020 Sep 28;21(19):7155. doi: 10.3390/ijms21197155. PMID: 32998306; PMCID: PMC7582739.
- Brugada J, Brugada R, Antzelevitch C, Towbin JA, Brugada P. Long-term follow-up of individuals with the electrocardiographic pattern of right bundle-branch block and ST-segment elevation in precordial leads V1 to V3. Circulation. 2002;105(1):73-8.
- Mizusawa Y, Wilde AA. Brugada syndrome. Circ Arrhythm Electrophysiol. 2012;5(3):606-16.
- Keller DI, Rougier JS, Kucera JP, Benammar N, Fressart V, Guicheney P, et al. Brugada syndrome and fever: genetic and molecular characterization of patients carrying SCN5A mutations. Cardiovasc Res. 2005;67(3):510-9.
- Mattu A, Brady WJ, Robinson DA. Electrocardiographic manifestations of hyperkalemia. Am J Emerg Med. 2000;18(6):721-9.
- Mattu A, Brady WJ, Robinson DA. Electrocardiographic manifestations of hyperkalemia. Am J Emerg Med. 2000 Nov;18(6):721-9. doi: 10.1053/ajem.2000.7344.
- Pfortmüller CA, Leichtle AB, Fiedler GM, Exadaktylos AK, Lindner G. Hyperkalemia in the emergency department: etiology, symptoms and outcome of a life-threatening electrolyte disorder. Eur J Intern Med. 2013;24(5) doi: 10.1016/j.ejim.2013.02.010.
- Littmann L, Gibbs MA. Electrocardiographic manifestations of severe hyperkalemia. J Electrocardiol. 2018;51(5):814-7. doi: 10.1016/j.jelectrocard.2018.06.018.
- Powerful Medical. Clinical validations: PMcardio AI-powered ECG interpretation. Powerful Medical [Internet]. 2023 [cited 2024 Sep 24]. Available from: https://www.powerfulmedical.com/blog/clinical-validations/
- Powerful Medical. PMcardio for organizations: AI-powered ECG interpretation. Powerful Medical [Internet]. 2023 [cited 2024 Sep 24]. Available from: https://www.powerfulmedical.com/pmcardio-organizations/
- Shamim S, McCrary J, Wayne L, Gratton M, Bogart DB. Electrocardiographic findings resulting in inappropriate cardiac catheterization laboratory activation for ST-segment elevation myocardial infarction. Cardiovasc Diagn Ther. 2014;4(3):215-223. doi:10.3978/j.issn.2223-3652.2014.05.01.
- Smith SW, Khalil A, Henry TD, Rosas M, Chang RJ, Heller K, Scharrer E, Ghorashi M, Pearce LA. Electrocardiographic differentiation of early repolarization from subtle anterior ST-segment elevation myocardial infarction. Ann Emerg Med. 2012;60(1):45-56. doi:10.1016/j.annemergmed.2012.02.015.
- Smith SW. T-wave amplitude to QRS amplitude ratio best distinguishes the ST elevation of anterior left ventricular aneurysm from anterior acute myocardial infarction. Acad Emerg Med. 2003;10:516–517.
- Klein LR, Shroff G, Beeman W, Smith SW. Electrocardiographic Criteria to Differentiate Acute Anterior ST Elevation Myocardial Infarction from Left Ventricular Aneurysm. Am J Emerg Med. 2015;33:786–790.
- Dodd KW, Zvosec DL, Hart MA, et al. Electrocardiographic Diagnosis of Acute Coronary Occlusion Myocardial Infarction in Ventricular Paced Rhythm Using the Modified Sgarbossa Criteria. Ann Emerg Med [Internet]. 2021. Available from: http://dx.doi.org/10.1016/j.annemergmed.2021.03.036
- Villablanca PA, Vlismas PP, Wiley J, et al. Case report and systematic review of pulmonary embolism mimicking ST-elevation myocardial infarction. Vascular. 2019;27(1):61-68. doi:10.1177/1708538118791917.


