Hyperacute T-Waves: A Comprehensive Pattern Exploration

The article aims to provide a comprehensive understanding of hyperacute T-waves, focusing on their diagnostic challenges and clinical implications, especially as a STEMI equivalent and a diagnostic feature of ACO myocardial infarction.
Hyperacute T waves are an important but poorly understood ECG feature of acute coronary occlusion (ACO) myocardial infarction1,2
By dissecting their defining characteristics, diagnostic challenges, and clinical implications, the article aims to equip readers with a comprehensive understanding of hyperacute T-waves and their relevance in cardiovascular medicine, particularly as a STEMI equivalent and a diagnostic feature of ACO myocardial infarction3.
Table of Contents
- Defining Hyperacute T-Waves Criteria
- Morphological Considerations
- Diagnostic Challenges and Comparisons
- Localization and Reciprocal Changes
- Differential Diagnosis and Reciprocal Reperfusion T-Waves
- Clinical Implications and Management Strategies
- Enhancing ECG Interpretation and Care Consistency with AI
- Concluding Insights on Hyperacute T-Waves
Defining Hyperacute T-Waves Criteria
The term hyperacute T waves is meant to describe a diagnostic feature of the T waves in the early progression of ECG findings caused by ACO. There is no accepted, universal definition of hyperacute T-waves, but experts describe them as symmetrically enlarged or inflated T waves compared to their QRS complex, and they could likely be defined as an elevation in the ratio of the area under the ST-segment and T-wave compared to the area/size of the QRS complex.
While some groups have described hyperacute T-waves simply as tall (absolute amplitude) recent research by Smith et al. challenges this oversimplified characterization. Their editorial reviewed recent evidence showing that raw T wave amplitude did not correlate with myocardial infarction diagnosis, but T wave amplitude relative to the preceding R wave was remarkable in distinguishing anterior benign early repolarization patients from subtle left anterior descending acute occlusion patients.
Furthermore, Smith and Meyers showed high specificity and diagnostic accuracy of expert-subjective hyperacute T waves (which they described as a ratio of area under the T wave compared to the QRS amplitude) in a large blinded cohort of potential ACS patients in the ED5.
Morphological Considerations
In addition to their increased height and breadth, hyperacute T waves have a more symmetric appearance compared to normal T-waves. Due to the increasingly broad base of the T wave, the QT interval also lengthens, which has been separately documented as one of the first observable measurement changes in acute coronary occlusion6.
Diagnostic Challenges and Comparisons
Hyperacute T-waves present diagnostic challenges that require careful consideration and comparison with baseline ECGs. While some cases may present with unequivocal hyperacute T-waves, others demand a comparative analysis to baseline morphology to discern subtle changes indicative of evolving myocardial ischemia. This comparative approach allows clinicians to differentiate between hyperacute T-waves associated with acute coronary syndromes and other T-wave abnormalities of benign origin7.
It’s important to note that hyperacute T-waves, indicative of early MI, can sometimes be mistaken for T-wave changes associated with hyperkalemia, where serum potassium levels exceed 5.5 mEq/L, leading to characteristic narrow, peaked T-waves, particularly notable in leads V2 and V38.
Localization and Reciprocal Changes
One of the key characteristics of hyperacute T-waves is their localization within the affected coronary distribution. These T-waves typically manifest in the territory supplied by the occluded coronary artery and may exhibit focal reciprocal changes mirroring the ischemic insult. This reciprocal pattern extends outward from the epicenter of the occlusion, reflecting the spatial extent of ischemic injury. By recognizing these localization patterns, clinicians can gain valuable insights into the underlying pathology and guide appropriate management strategies9.
Differential Diagnosis and Reciprocal Reperfusion T-Waves
Distinguishing true hyperacute T-waves from other T-wave abnormalities, particularly reciprocal reperfusion T-waves, is essential for accurate diagnosis and management. Reciprocal reperfusion T-waves may masquerade as hyperacute T-waves but typically emerge post-reperfusion, accompanied by diminishing pain. Clinicians should carefully evaluate the clinical context and ECG findings to differentiate between these entities and to determine appropriate treatment plans10.
Clinical Implications and Management Strategies
Prompt recognition and appropriate management are essential to mitigate the risk of adverse cardiac events and optimize patient outcomes. Healthcare providers should initiate a comprehensive evaluation, including serial ECG monitoring, cardiac biomarkers, and imaging studies, to confirm the diagnosis and assess the extent of myocardial injury. Emergent reperfusion therapies are paramount in optimizing patient outcomes and reducing morbidity and mortality associated with ACO11,12.
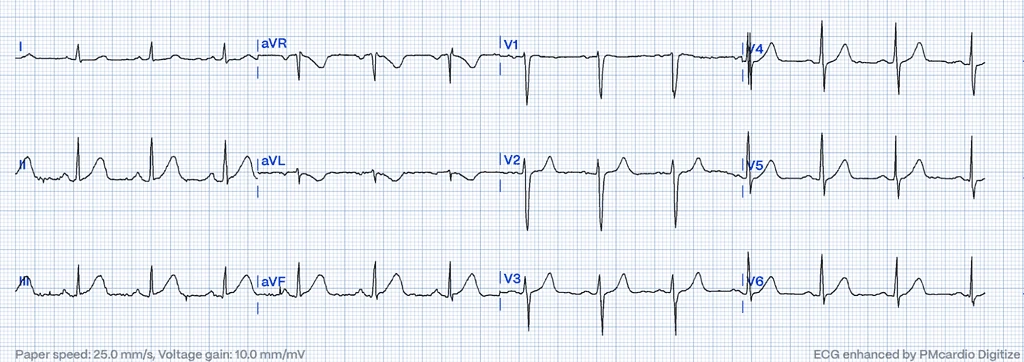
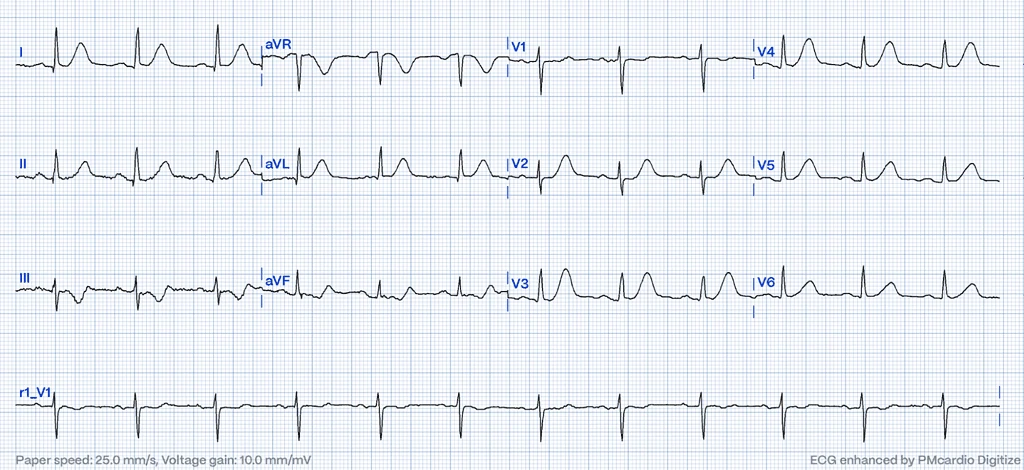
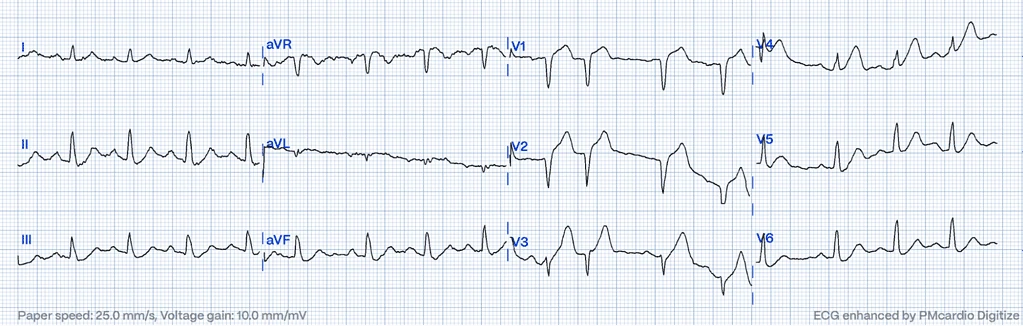
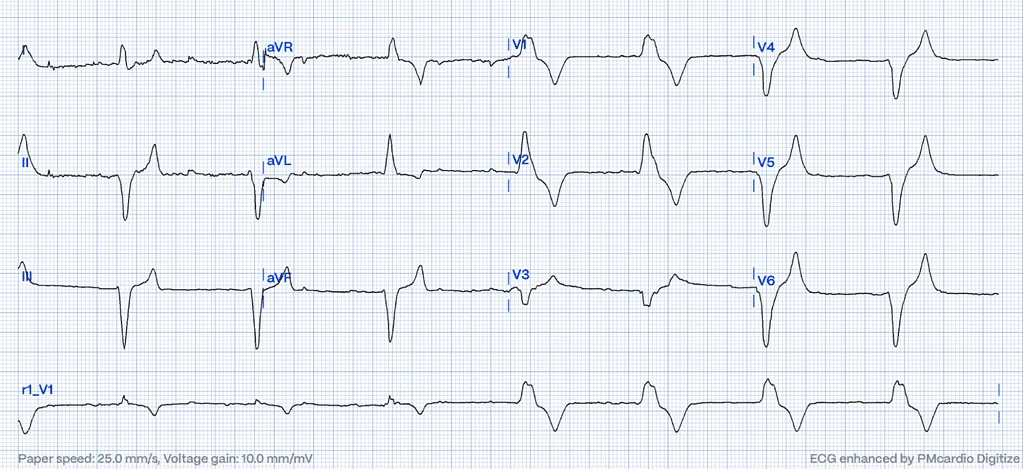
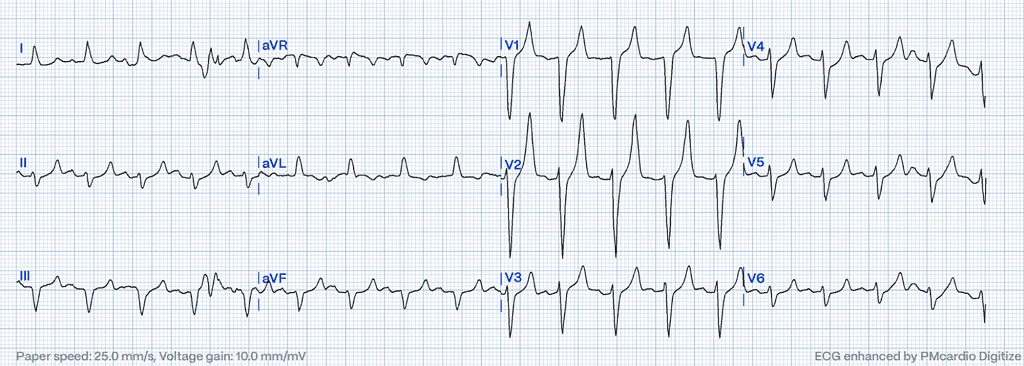
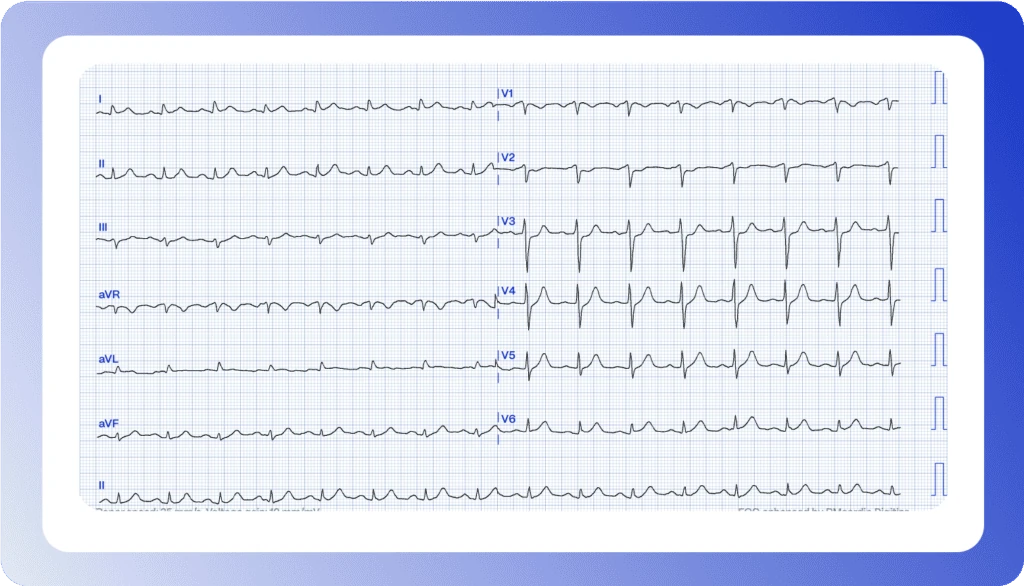
Can you interpret this ECG?
It’s 11:30 PM, and a 67-year-old male patient presents with two hours of ongoing chest pain. Would you refer for an emergent coronary angiography?
Enhancing ECG Interpretation and Care Consistency with AI
Recognizing hyperacute T-waves as STEMI equivalents underscores the critical importance of early intervention in optimizing patient outcomes13. However, identifying them correctly can be challenging due to their nuanced presentation and potential overlap with other ECG abnormalities.
In this context, for healthcare personnel with varied experience and skills in interpreting ECGs, specializing in Occlusion Myocardial Infarction (OMI), the PMcardio OMI AI Model offers cutting-edge technology designed to augment the chest pain patients’ journey. This innovative solution is not only aimed at assisting in the accurate identification of subtle ischemic patterns, potentially overlooked in standard evaluations, but also ensures that each patient receives the same high standard of care when it comes to ECG diagnosis. By integrating advanced algorithms, PMcardio offers consistency in the interpretation of complex ECG patterns across different healthcare providers and settings, thereby enhancing the precision and reliability of OMI detection and supporting equitable care delivery.
Dr. Stephen W. Smith, Dr. H. Pendell Meyers, and Dr. Robert Herman insights into the (Occlusion Myocardial Infarction) OMI AI model.
Concluding Insights on Hyperacute T-Waves
In this review, we’ve untangled the complexities of hyperacute T-waves to equip healthcare professionals with the essential knowledge for their accurate identification, diagnosis, and effective management. Much remains to be studied and understood about hyperacute T waves.
Our aim is to facilitate the adoption of consistent and precise ECG interpretation standards across patient care, ensuring that every individual receives a uniform level of diagnostic accuracy. Highlighting the integration of advanced technologies, like the OMI AI ECG model, underscores our commitment to supporting healthcare providers in achieving this goal, as we envision a standardized approach to ECG interpretation that benefits patients universally.
This article was edited by Dr. H. Pendell Meyers.
References
- 1. Smith SW. The ECG in Acute MI: An Evidence-Based Manual of Reperfusion Therapy. Springer; 2008.
- 2. Smith SW. Hyperacute T-waves: Understanding the ECG signs of early myocardial infarction. Dr. Smith’s ECG Blog. Available from: https://hqmeded-ecg.blogspot.com/[specific-post-url]. Accessed April 9, 2024.
- 3. Thygesen K, Alpert JS, Jaffe AS, et al. Fourth universal definition of myocardial infarction (2018). Eur Heart J. 2019;40(3):237-269.
- 4. Wagner GS, Marriott HJL. Marriott’s Practical Electrocardiography. 12th ed. Lippincott Williams & Wilkins; 2014.
- 5. Smith SW. Hyperacute T-waves Can Be a Useful Sign of Occlusion Myocardial Infarction if Appropriately Defined. Ann Emerg Med. 2023 Mar 3. doi: 10.1016/j.annemergmed.2023.01.011.
- 6. Kenigsberg DN, Khanal S, Kowalski M, Krishnan SC. Prolongation of the QTc Interval Is Seen Uniformly During Early Transmural Ischemia. J Am Coll Cardiol. 2007 Mar 6;49(9):1299-305. doi: 10.1016/j.jacc.2006.11.035.
- 7. Libby P, Bonow RO, Mann DL, Zipes DP. Braunwald’s Heart Disease: A Textbook of Cardiovascular Medicine. 10th ed. Elsevier; 2015.
- 8. Somers MP, Dressler W, Nable JV, Keeley EC. The prominent T wave: electrocardiographic differential diagnosis. Am J Emerg Med. 2002 May;20(3):243-51
- 9. de Winter RJ, Verouden NJ, Wellens HJ, Wilde AA. A new ECG sign of proximal LAD occlusion. N Engl J Med. 2008;359(19):2071-3.
- 10. Otto C. Textbook of Clinical Echocardiography. 5th ed. Elsevier; 2013.
- 11. O’Gara PT, Kushner FG, Ascheim DD, et al. 2013 ACCF/AHA guideline for the management of ST-elevation myocardial infarction: a report of the American College of Cardiology Foundation/American Heart Association Task Force on Practice Guidelines. Circulation. 2013;127:e362-e425.
- 12. Jneid H, Anderson JL, Wright RS, et al. 2012 ACCF/AHA Focused Update of the Guideline for the Management of Patients With Unstable Angina/Non–ST-Elevation Myocardial Infarction (updating the 2007 guideline and replacing the 2011 Focused Update): a report of the American College of Cardiology Foundation/American Heart Association Task Force on Practice Guidelines. Circulation. 2012;126:875-910.
- 13. Powerful Medical. Powerful Medical Website. Available from:/. Accessed April 10, 2024.
Share this article
About PMcardio
PMcardio is a CE-marked Class IIb AI medical device that interprets any 12-lead ECG — from a photo or a digital file — in seconds. It detects 50+ ECG findings, including occlusion myocardial infarction (OMI) — the acute coronary occlusions that conventional STEMI criteria miss in over half of cases. Its Queen of Hearts™ OMI model holds FDA Breakthrough Device Designation, and PMcardio is already used by 100,000+ clinicians who have analyzed more than 2.5 million ECGs.
About Powerful Medical
Powerful Medical is a medical-technology company using artificial intelligence to transform how cardiovascular disease — the world’s leading cause of death — is diagnosed. Founded in 2017, it built PMcardio, the world’s first AI medical device to detect acute coronary occlusion (OMI) from an ECG. Its research is published in the European Heart Journal – Digital Health and validated across 25+ clinical studies, and its Queen of Hearts™ model earned FDA Breakthrough Device Designation. To date, PMcardio has supported the detection of 120,000+ heart attacks across 150+ hospital deployments worldwide.


